
Welcome to Genome Enhancer
Hello and welcome to Genome Enhancer – an automated pipeline for patient’s multi-omics data analysis, which generates a comprehensive report about the personalized drug targets identified for a certain patient, or a group of patients, and the drugs that may be effective in this case.
You are currently at the very first step of Genome Enhancer wizard, which allows you to browse the available projects or create a new project.
Being a new user, you would first have to subscribe to Genome Enhancer’s trial or paid subscription to create your own project and start the analysis. You can manage your subscriptions and activate your free trial here.
The demo projects are always available for your info regardless of the active subscriptions. You can click on any of them and browse the analysis report. The reports which will be generated by Genome Enhancer based on the analysis of your own data will look similar to the demo reports.
After activating a demo or a paid subscription, you can create a new project or select an existing one to work in it. Please note that you will not be able to work inside the demo projects, as they are given only for your familiarization.
Once the project has been created or selected from the list of your already existing projects, you will be taken to the next step of the Genome Enhancer wizard called Upload my data.
The buttons denotations
 |
Log out – performs logging out from Genome Enhancer. You can use this button for switching to another account or simply exiting your current session for safety reasons |
 |
Home – takes you to the first Select project step of the Genome Enhancer wizard |
 |
Account info – opens Store from which you can browse and manage your subscriptions and administer/share your projects |
 |
Help – opens supporting information which is actual for your current step of the Genome Enhancer wizard |
 |
Previous – takes you to the previous step of the Genome Enhancer wizard |
 |
Next - takes you to the next step of the Genome Enhancer wizard |
More information about Genome Enhancer
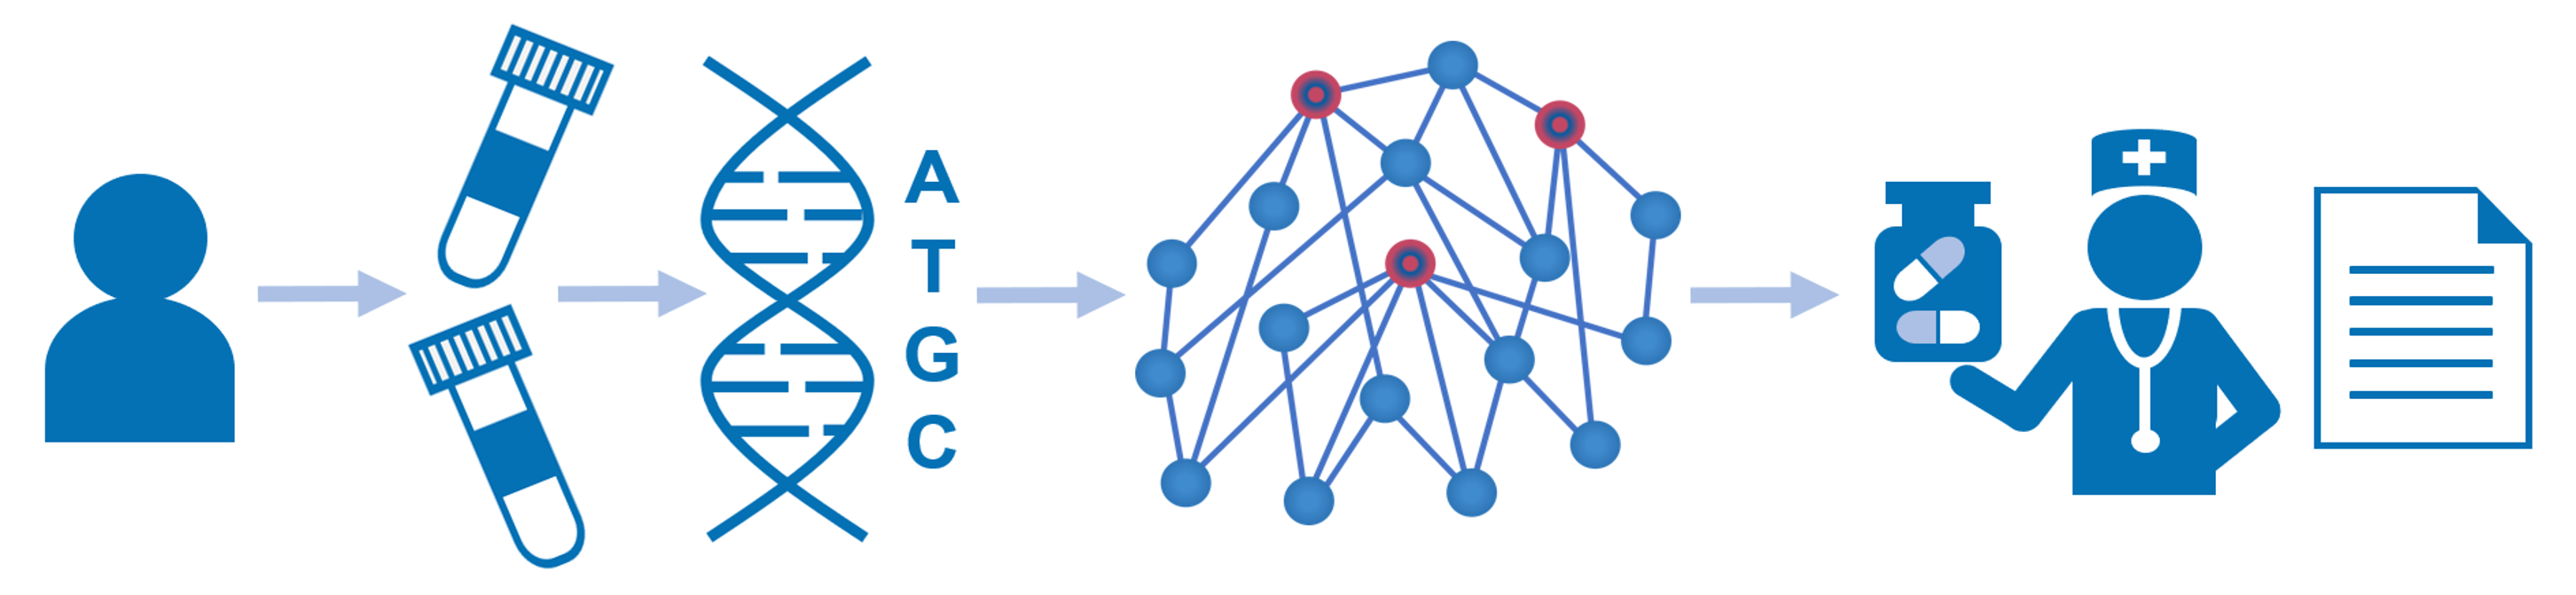
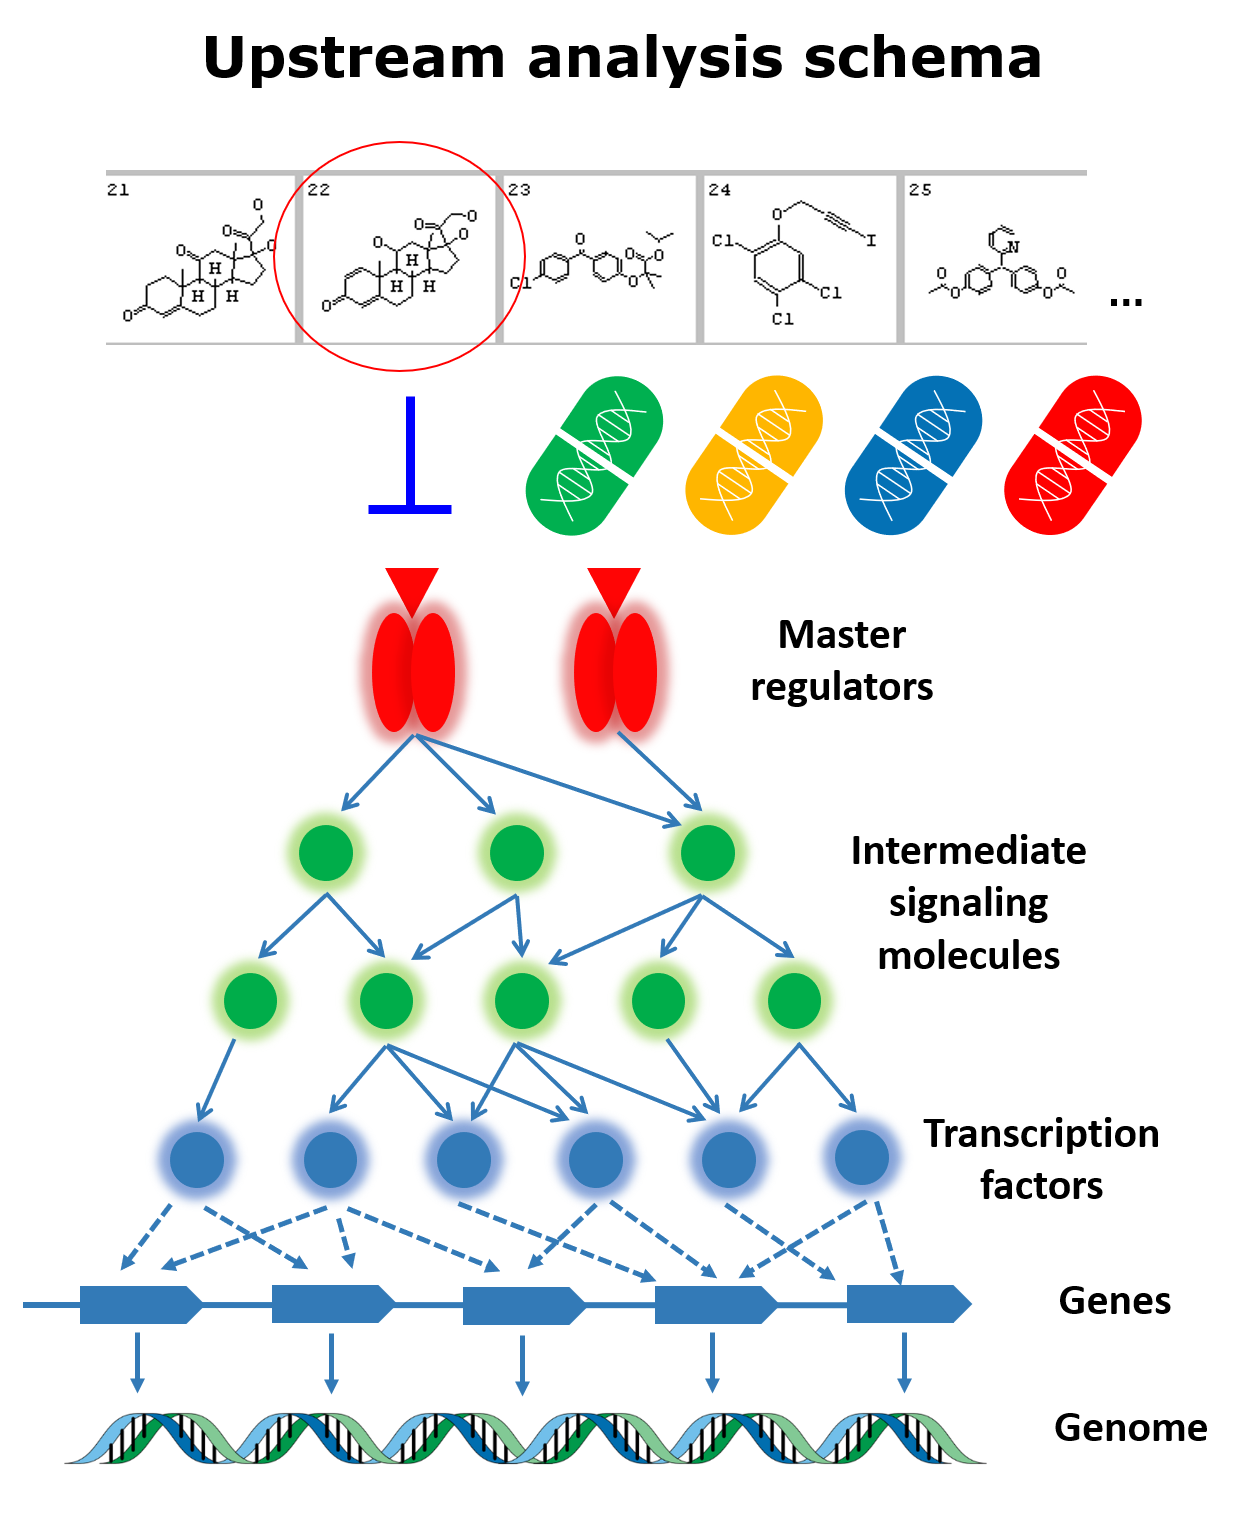
The Genome Enhancer pipeline performs a fully automated analysis of patient omics data, including genomics, transcriptomics, proteomics, epigenomics and metabolomics data. After an easy data upload and annotation step you simply launch the analysis with an option to select the related disease name, tissue or cell type. A comprehensive analysis report will be generated, which will include detailed information about the methods used and the results obtained, including genes that characterize the studied pathology, the transcription factors that regulate those genes, and the reconstructed model of the intracellular signaling network with identified master regulators – the potential drug targets for treating the studied pathology. The algorithm used to identify key regulatory elements is geneXplain’s proprietary Upstream Analysis, which involves the knowledge stored in the databases TRANSFAC® and TRANSPATH®. The report also includes information about further chemical compounds that may affect the identified targets. This information is obtained with the PASS tool for prediction of chemical compounds activity and HumanPSD™ database of gene-disease assignments.
Key features
- A clear result, issued as a scientific paper
- Suitable for direct use by medical doctors and biologists
- Does not require special skills
- Processes all types of omics data
- Easy data upload and annotation
- One-click run
- Generates a report on the identified drug targets and prospective therapies
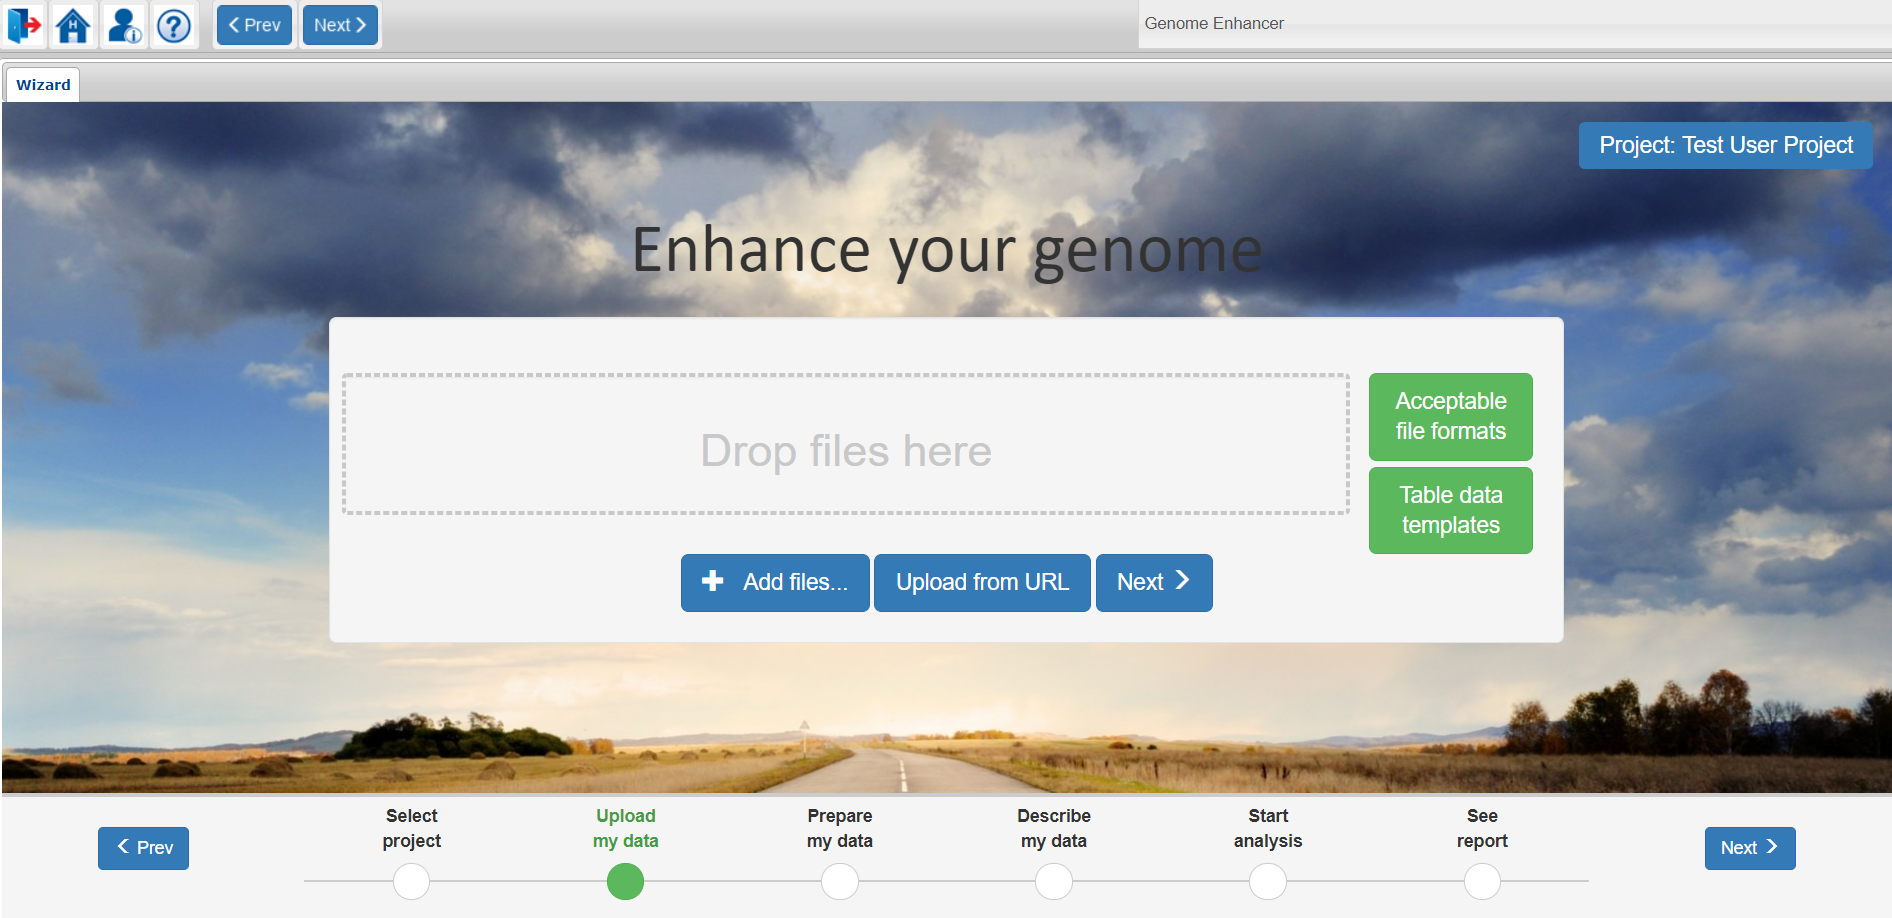
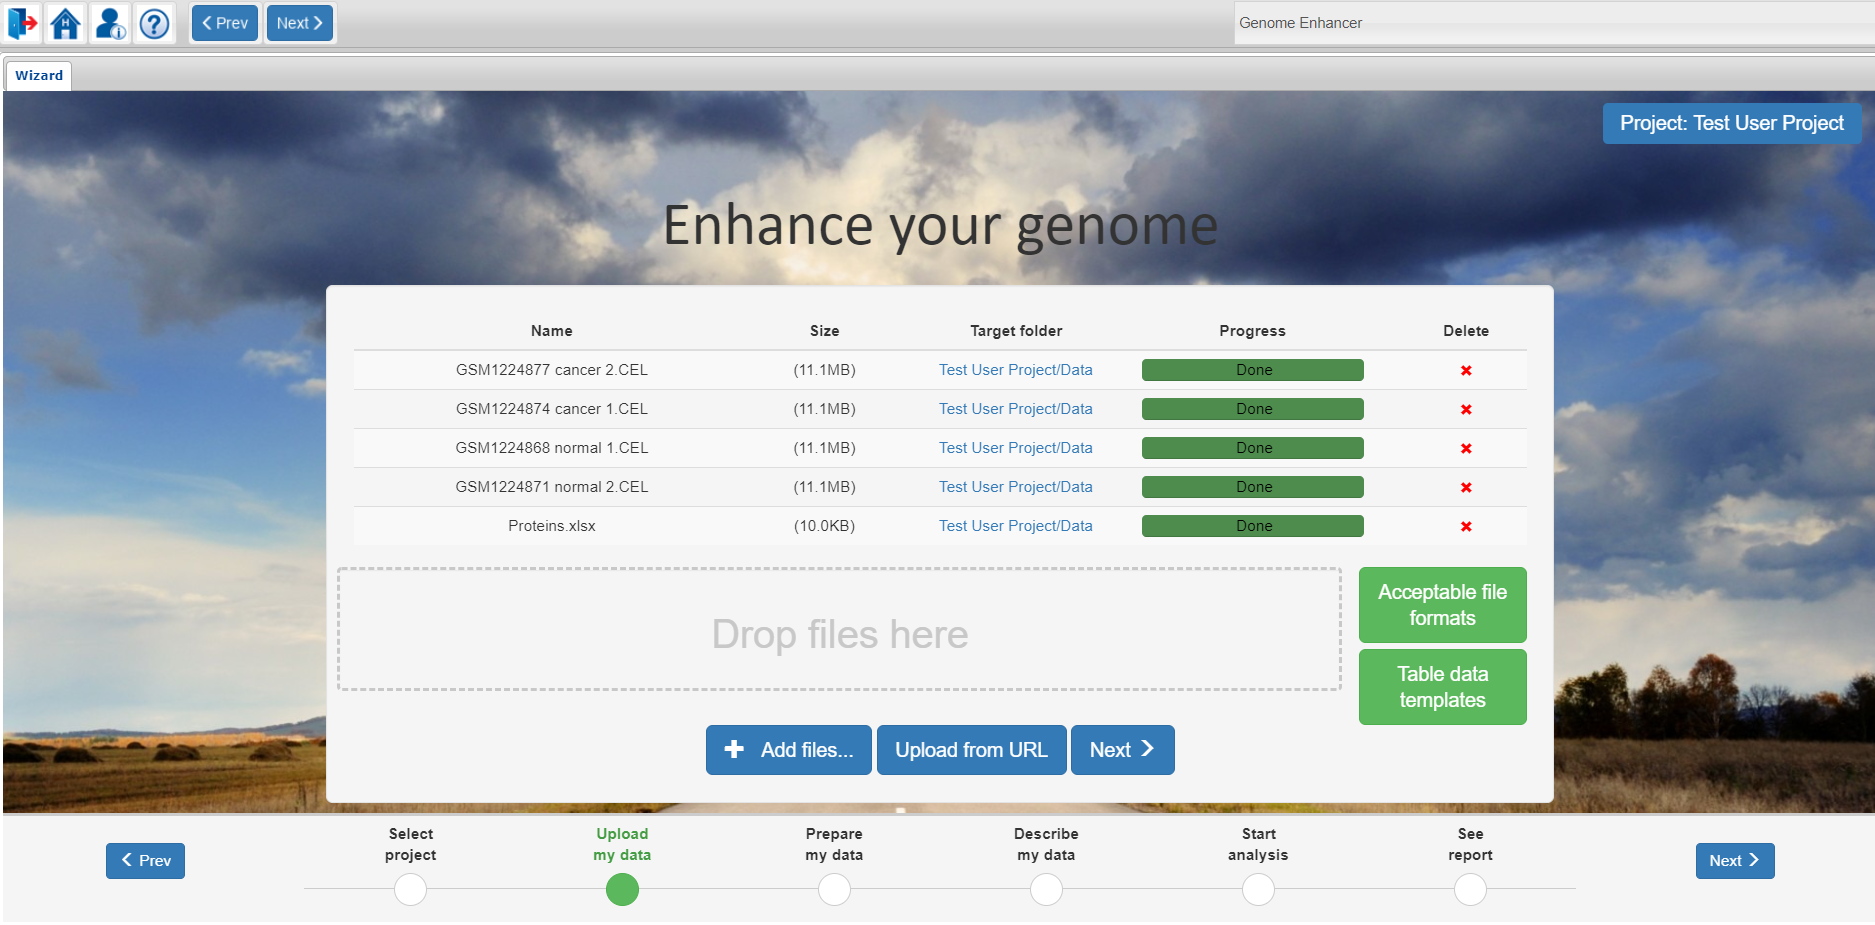
Upload my data
At this step of the Genome Enhancer wizard you can upload the data you want to analyze in the selected project.
Genome Enhancer supports data upload from your local computer and from a remote server.
For uploading data from your local computer you can just drag and drop the files you want to analyze into the Drop files here window or click on the Add files button to select the files from a system dialog window.
For remote upload please use the Upload from URL button.
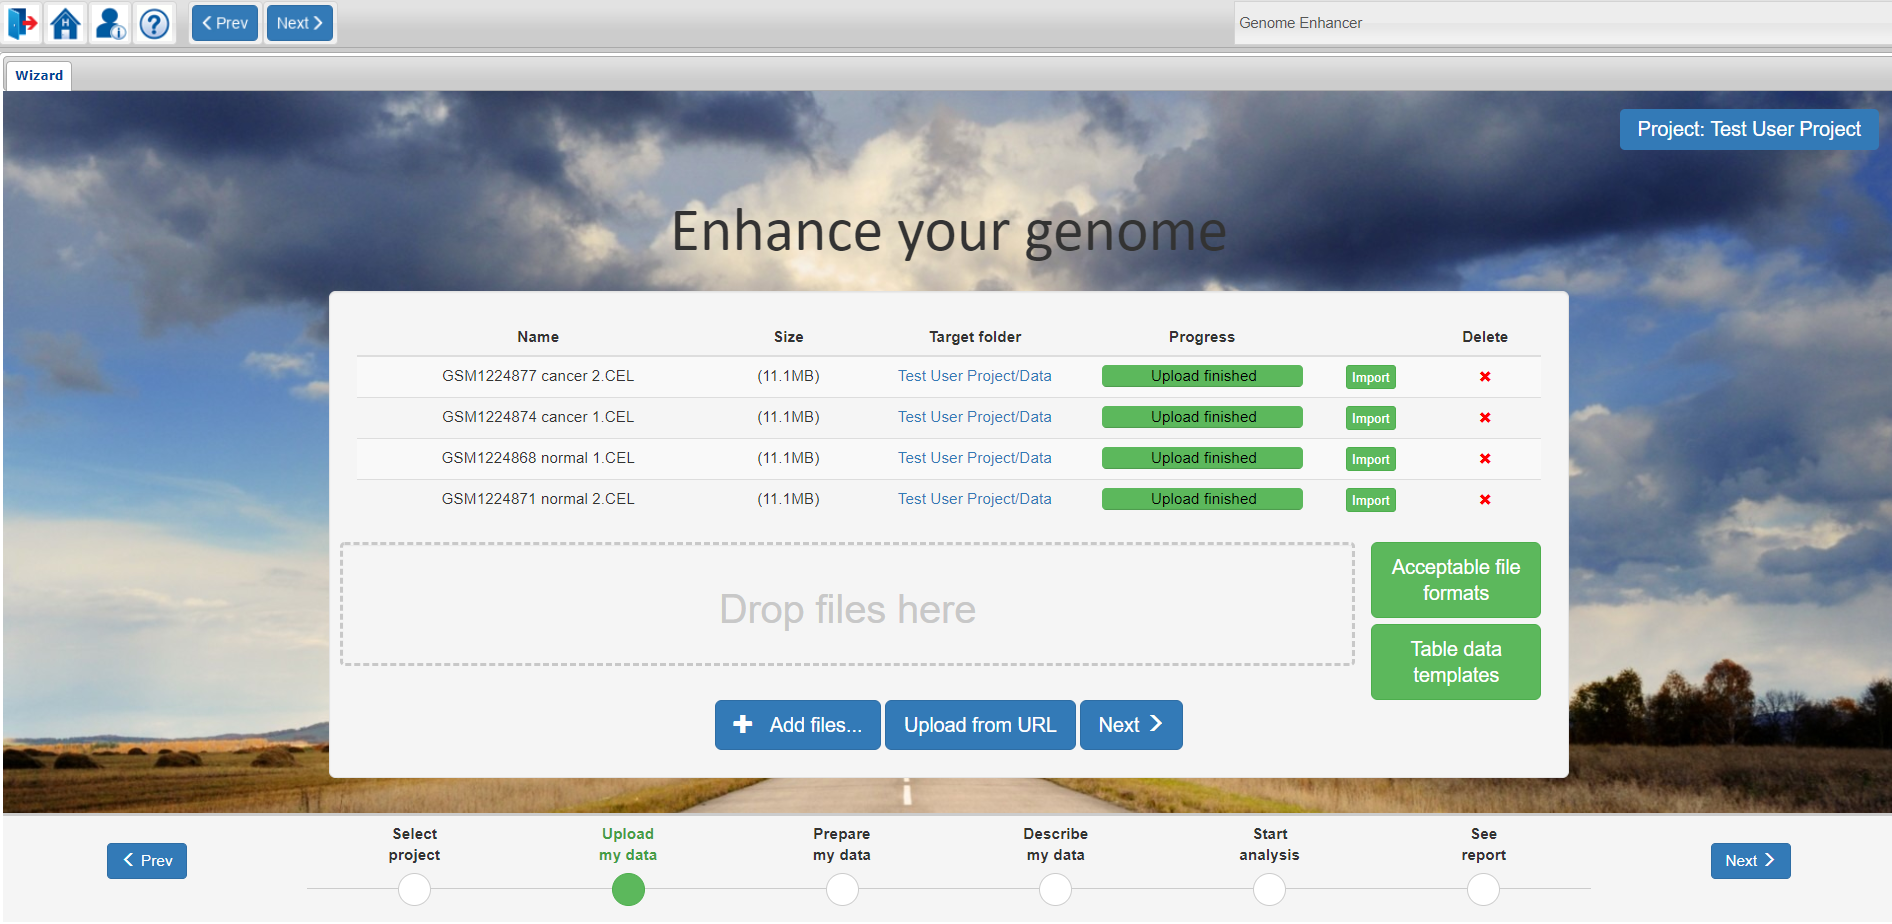
You will find a full list of acceptable file formats which can be analyzed in Genome Enhancer under the Acceptable file formats button. Files of same data type can be uploaded in a .zip archive.
If your data comes in the ASCII tabular text format or as an Excel table, please refer to the templates of preferred data representation, which can be found under the Table data templates button. As an ID of a gene or protein you can use the following variants:
Genes with IDs from:
- Ensembl
- Entrez
- GeneBank
- Gene Symbol
- RefSeq
- Unigene
- Illumina
- Proteome
- TRANSPATH
- BKL
Proteins with IDs from:
- Reactome
- TRANSPATH
- Ensembl
- GeneBank
- IPI
- RefSeq
- TRANSFAC
- TRANSPATH
- Uniprot
- BKL
- EndoNet
- GTRD
- NCBI
- PDB
- Recon2
For metabolites table data please use the ChEBI database IDs
For tabular genomic data (lists of SNPs), please use IDs from DBSNP database (rsXXXX numbers).
For tabular epigenomic data (DNA methylation profiling done with microarrays), please use probeset IDs from the respective microarray platform (Illumina or Affimetrix methylation arrays).
After Upload is finished, click on the Import button to specify the file import options.
Depending on the file type, different pop-up windows will file importing options will open.
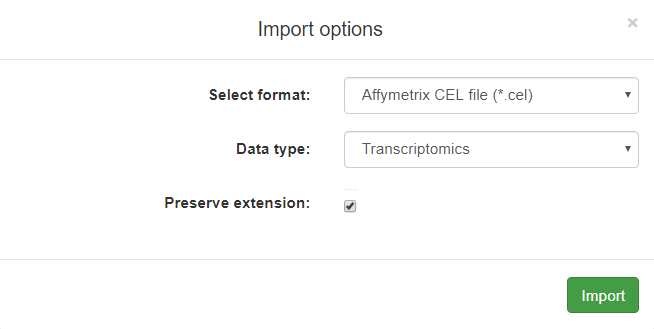
This example is showing a pop-up Import options window for a .CEL file type:
A more complicated example below is showing a pop-up Import options window for a table with proteomics data:
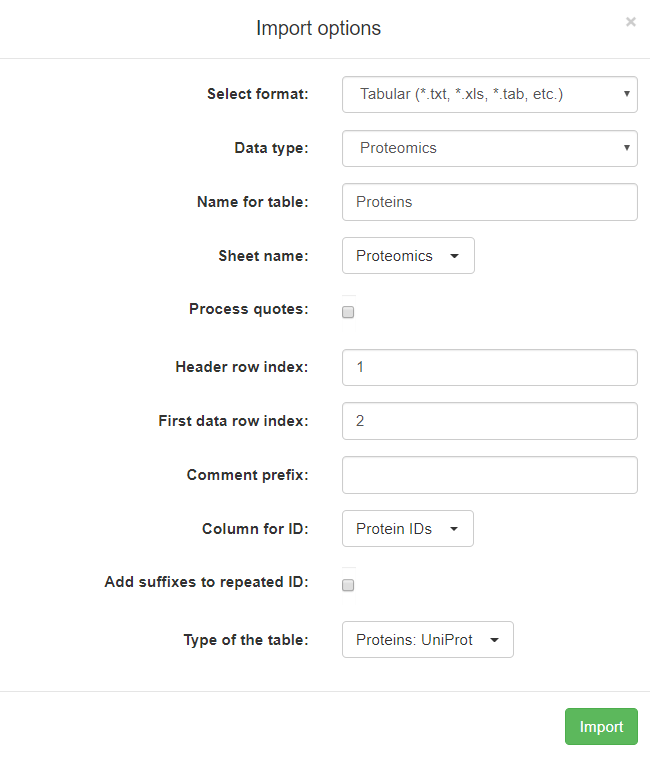
Here is the full description of all fields in this pop-up window:
Select format: you should specify the format of your data by selecting from a drop-down list. The format of the data is autodetected by a text analysis algorithm, but in some (quite rare) cases when the autodetect algorithm fails to detect the format correctly, please, use this field to select the right data format.
Data type: you need to select which type of data you are importing (transcriptomics/proteomics/genomics/epigenomics/metabolomics)
Name for table: you can change the name of your table using this field
Sheet name: you should specify the name of the sheet, which you want to import the data from
Process quotes: check this checkbox if you want to skip quotes (" symbols) and ignore delimiters between them
Header row index: put the number, corresponding to the index of row with column names in your table; if you have no headers in your table, put 0
First data row index: put the number, corresponding to the index of the first row with data in your table
Comment prefix: any table line starting with the string defined in this field will be skipped
Column for ID: the column specified in this field will be used as ID
Add suffixes to repeated ID: if you check this checkbox, then for any ID repeating in the table a suffix _COPYNN will be added to it
Type of the table: specify the data sub-type (gene/protein/probe/genomic variants etc.) of your data represented in the table
If you have used the provided table data templates for creating your tabular data files, then most likely the default parameters, which were auto-detected by Genome Enhancer, will be correct. Please check all fields and click on the Import button.
In case you have any doubts about the format of your table data, please manually correct the auto-detected parameters in accordance with your file.
After you have finished importing your data, please proceed to the next step of the wizard by clicking on the Next button.
Further on, you will be able to navigate through the wizard with the use of Prev and Next buttons at the top menu panel or at the bottom navigation panel of Genome Enhancer. You can also jump directly to a certain step of the wizard by clicking on its name at the bottom navigation panel.
Prepare my data
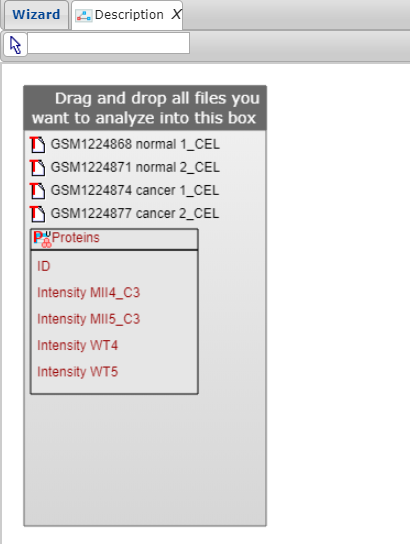
At this step of the Genome Enhancer wizard you will select all data you want to use for the current analysis.
First, drag and drop all files you want to use in your analysis from the tree on the left side to the gray box on the right.
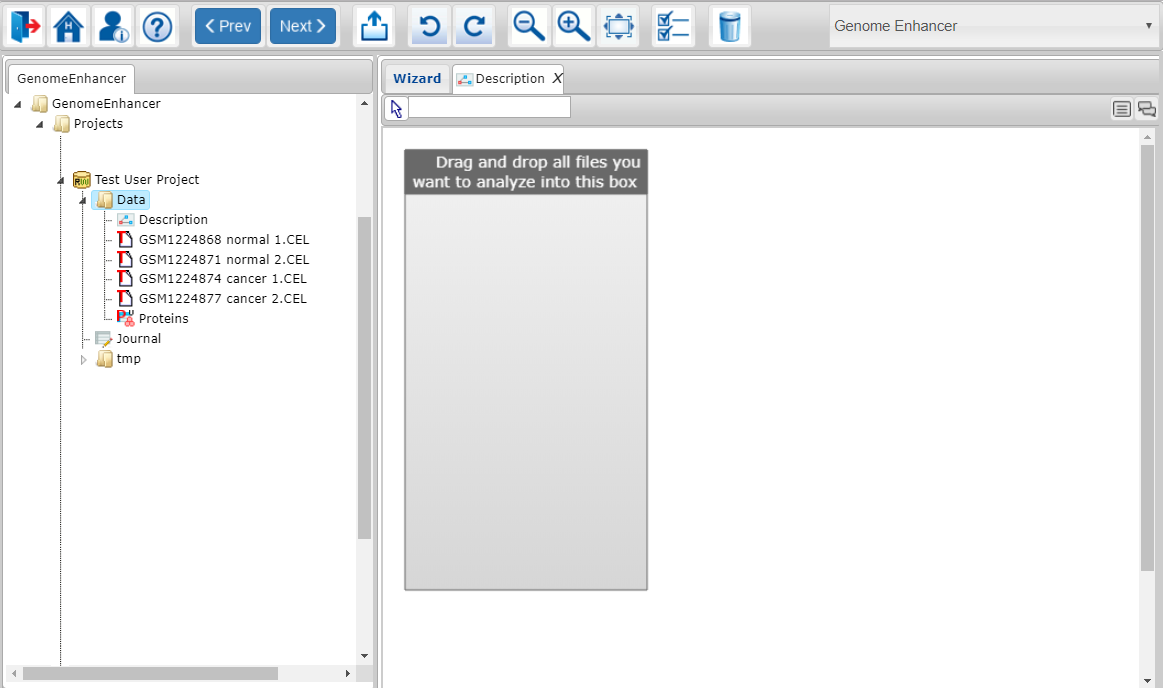
Note that tabular files will be represented as a collection of table columns names (all columns with quantitative data from each table and the key-ID column), so you can use them as individual entities for further comparison.
Once you have finished selecting the files for your analysis, click on the Next button at the top menu panel of Genome Enhancer to proceed to the data description.
If you would like to add other data to your analysis afterwards, you will have to return to this step of Genome Enhancer wizard by using the Prev button.
Describe my data
At this step of the Genome Enhancer wizard you assign all data you have selected for the current run to the categories which will be compared during the planned analysis.
By default the Experiment and Control categories (colored boxes), referring to the corresponding conditions for further comparison, will be created by Genome Enhancer.
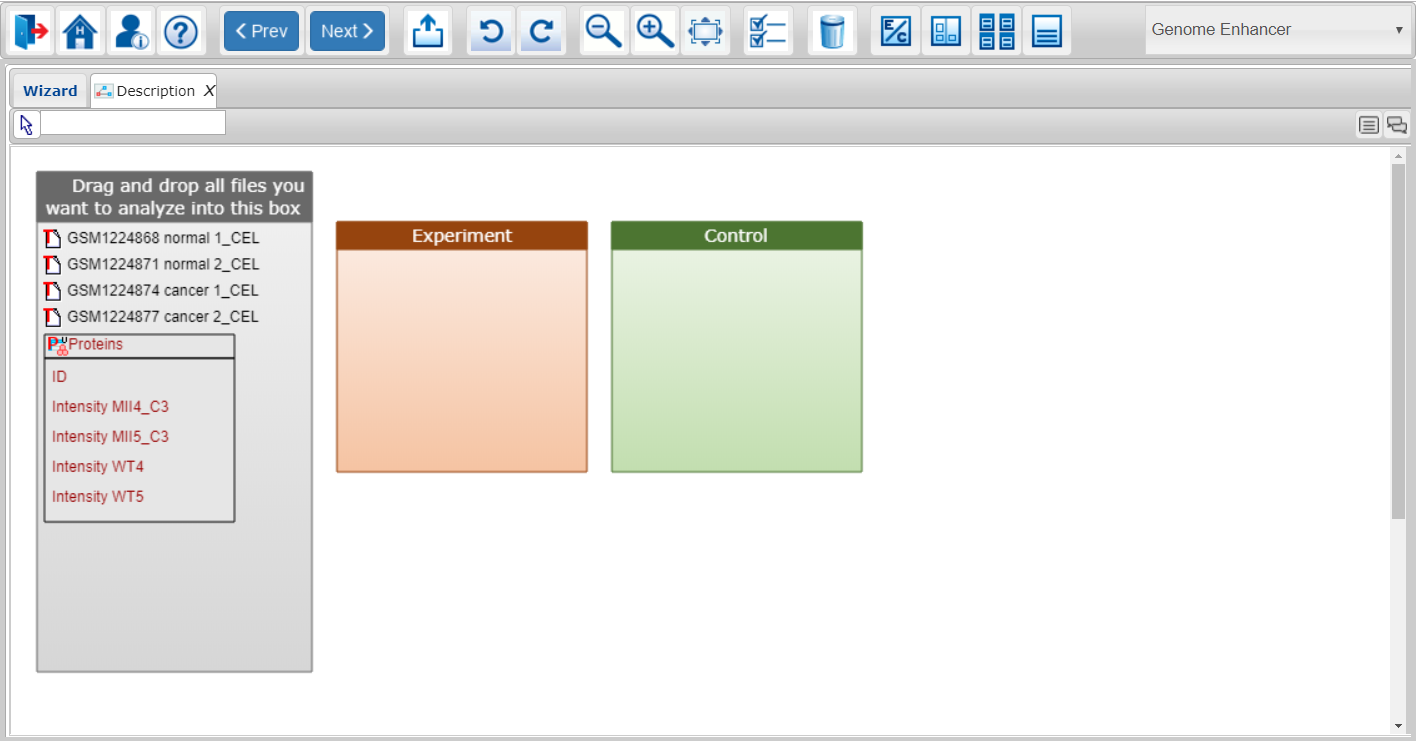
You should spread your data within the categories (conditions you want to compare).
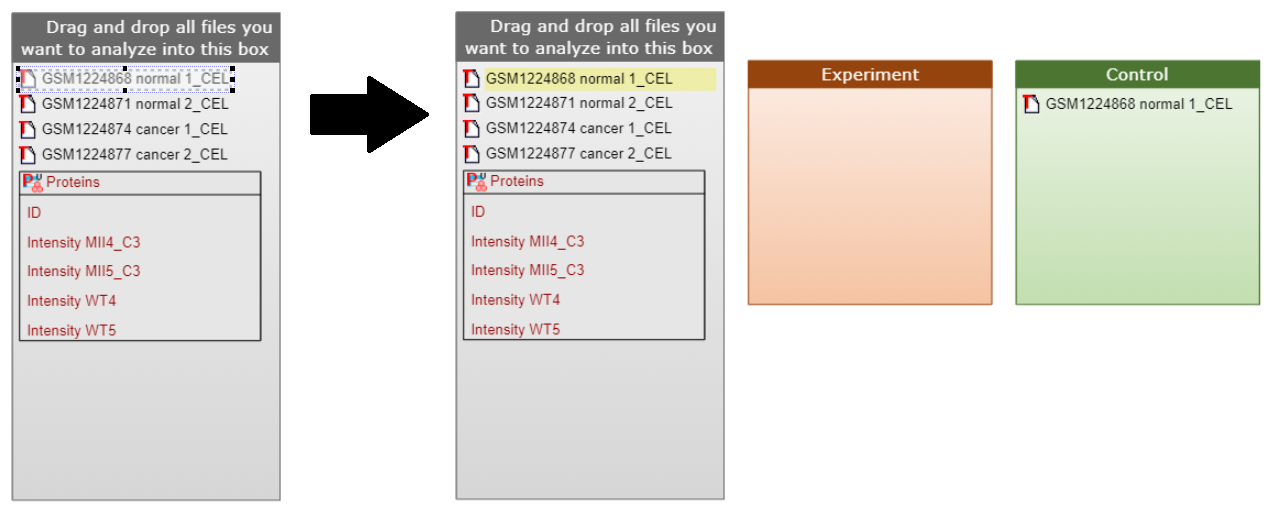
Simply click on the data element you want to move and make sure that it became framed. Now you can drag and drop this data element to the corresponding category. Already used data elements will be highlighted with yellow for your convenience, however you can use them multiple times in more complex data annotation diagrams.
For creating a custom data description diagram please use the buttons from the top menu panel of Genome Enhancer.
The buttons denotations:
 |
Export – allows you to export the constructed data annotation diagram in various formats |
 |
Redo – repeats the previously undone action |
 |
Undo – cancels the previous action |
 |
Zoom out – zooms out the data annotation diagram overview |
 |
Zoom in – zooms in the data annotation diagram overview |
 |
Fit to screen – scales the data annotation diagram to fit the screen |
 |
Edit diagram appearance – opens the styles/colors/fonts options of the whole data annotation diagram |
 |
Edit diagram element appearance – opens the styles/colors/fonts options of the selected data annotation diagram element. For creating your own data element style use the ‘not selected’ style variant. |
 |
Diagram view options – opens the styles/colors and name options of the selected diagram object |
 |
Remove selected – deletes the selected element from the data annotation diagram |
 |
Rename selected element – allows to give custom names to the elements of data annotation diagram (comparison categories) |
 |
Create logical category – creates a new category (box), to which you can drag and drop other categories (boxes) for making complex comparisons |
 |
Create experiment vs control category – creates the standard Experiment and Control categories (boxes) |
 |
Create multiple categories – creates as much simple categories (boxes) as you will specify: the Number of rows parameter refers to the number of simple category rows you want to have at the data annotation diagram and the Number of columns parameter refers to the number of simple categories in a row you will need. |
 |
Create single category – creates one simple category (box) |
You can also modify the names of the categories (boxes), their styles and colors by using the Edit option, which opens by a right-click on any of the boxes.
After you have finished spreading your data throughout the categories you want to compare for your analysis, click on the Next button at the top menu panel of Genome Enhancer to proceed to the Start analysis step of the wizard. Please note, that when the quantitative columns are used in the next steps of the GE algorithm, they become subjects of statistical analysis for detection of the "clusters" (specific subsets of the entries of the table, e.g. subset of up-regulated genes or down-regulated genes). The ID columns of the tables can be also spread into the categories (boxes). In such cases, the ID columns are used by Genome Enhancer algorithm at the next steps as indicators that the whole list of entries of the table should be taken as a ready "cluster" for the further analysis.
For table data the ID column cannot be added simultaneously with any other data column from the same table to one category (condition box). If you add an ID column, all genes/proteins from that list will be used by Genome Enhancer as a cluster for further analysis. If you add a numerical column (expression values or counts), Genome Enhancer will work with this data and identify upregulated/downregulated genes or proteins based on the provided values. If you have already placed the ID column or the data column into the category, and now you would like to change your selection, please first remove the respective element from the category by first clicking on it and then pressing on the ‘remove selected’ button on the top menu panel (dust bin icon), and only then add the other data element, which you would like to submit to that category.
Examples of data annotation diagram design
Analysis of one pathological process without a control (reference) set
With such scenario data coming from one patient, or a group of patients with similar pathologies, can be analyzed. All available data about the studied pathology should be submitted to one condition (category for comparison) and the analysis should be started with this one condition in the launching options.
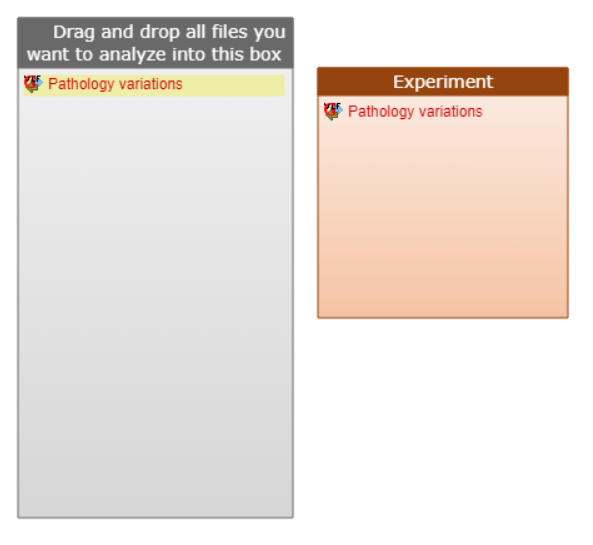
Example 1. Genomics data for 1 patient
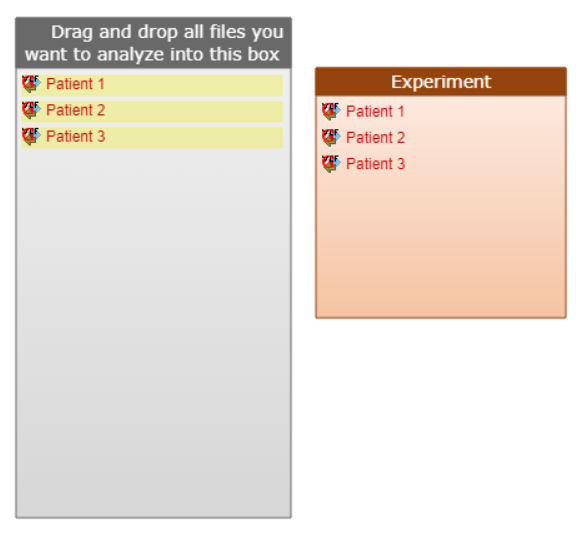
Example 2. Genomics data for 3 patients with the same pathology
Analysis of one pathological process with a control (reference) set
With such scenario the data coming from one patient, or a group of patients, should have paired samples of pathology data and reference control data. Not necessarily each file from ‘Experiment’ should have a corresponding by omics type file in ‘Control’. Pathology and control data can be of different omics types and they simply should refer to the corresponding condition.
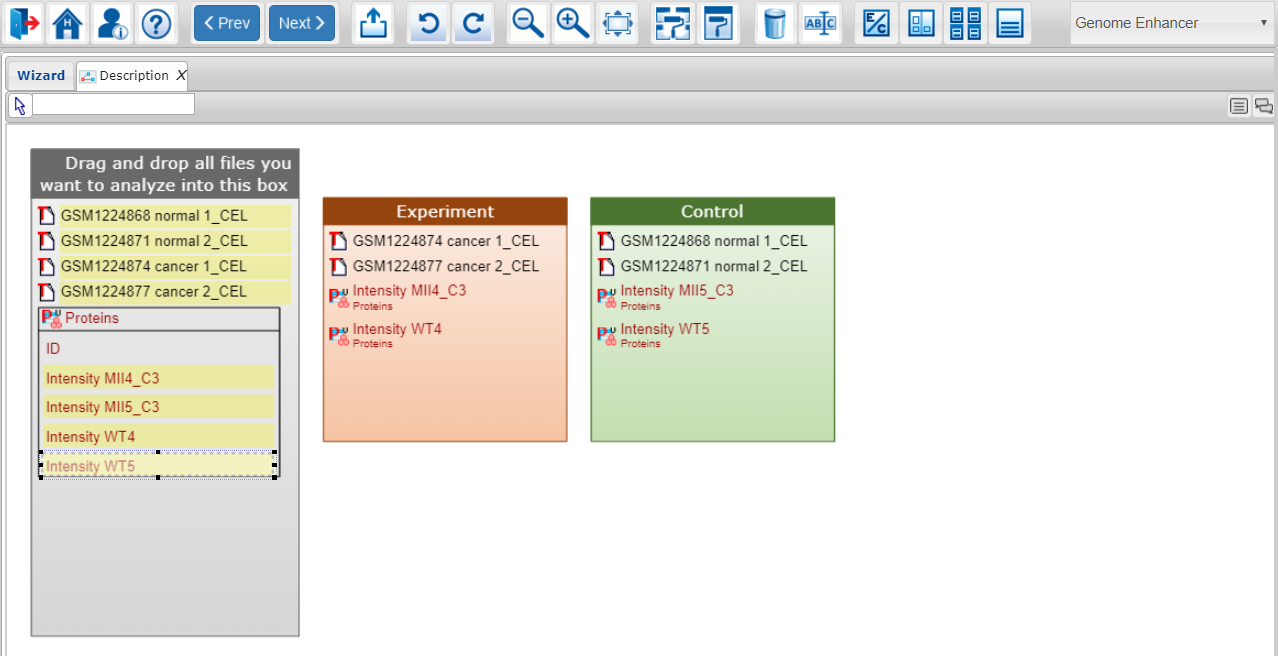
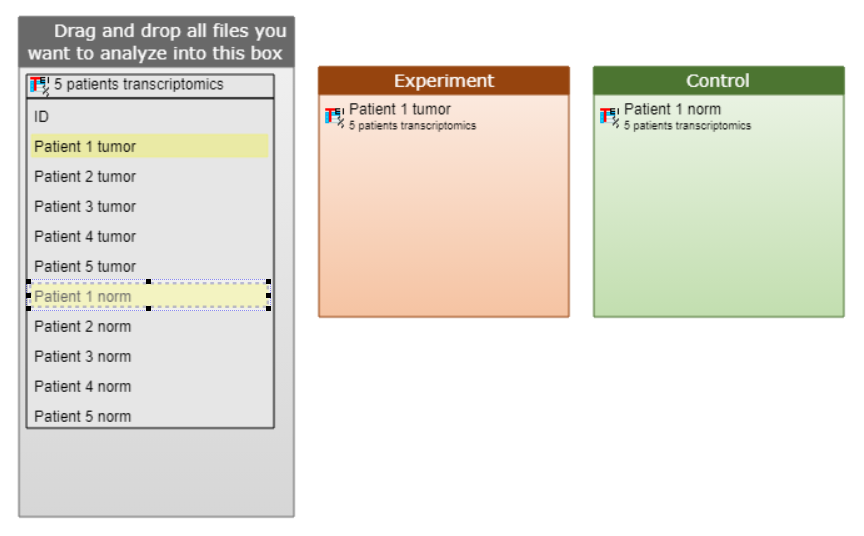
Example 1. This example shows transcriptomics data analysis of 1 patient, for whom both: the disease gene expression and the norm gene expression data were available.
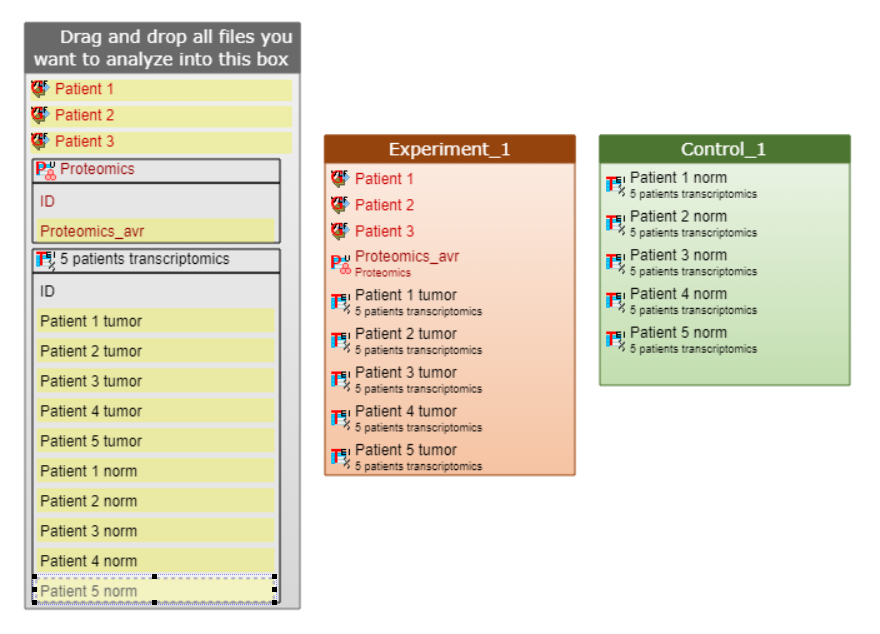
Example 2. This example shows a complicated analysis of several patients with paired samples of transcriptomics data for pathology and normal states (e.g. cancer tissue expression vs. expression in normal tissue of the same organ coming from one patient), as well as proteomics data, relevant for the studied pathology and genomics (mutation) data of the studied pathology, which was available for several patients.
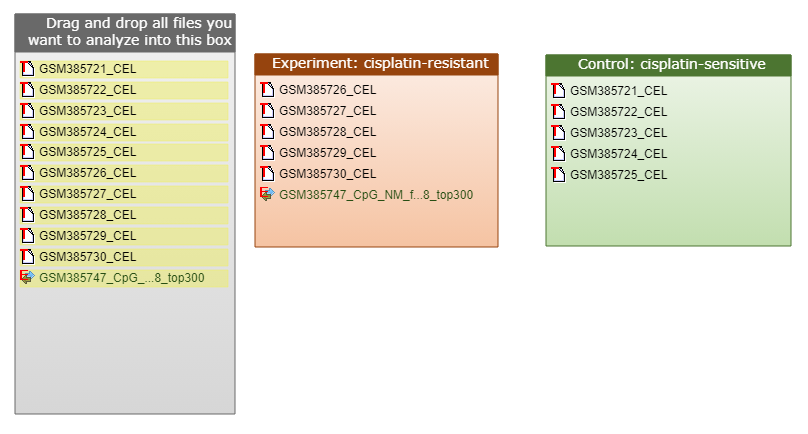
Example 3. Sensitivity and resistance studies: this example assumes that we have 2 cell lines available – one sensitive to the studied treatment and the other one resistant to it. The goal is to find therapeutic agents which would turn the resistant line into a sensitive one. Transcriptomics data (CEL files) are available for both: sensitive and resistant conditions. Epigenomics BED file is also available for the resistant condition.
Analysis of several conditions
In case of multiple conditions, different analysis scenarios can be applied depending on the clustering or baseline option selection during the analysis launch (see guidance for analysis launch step for further info).
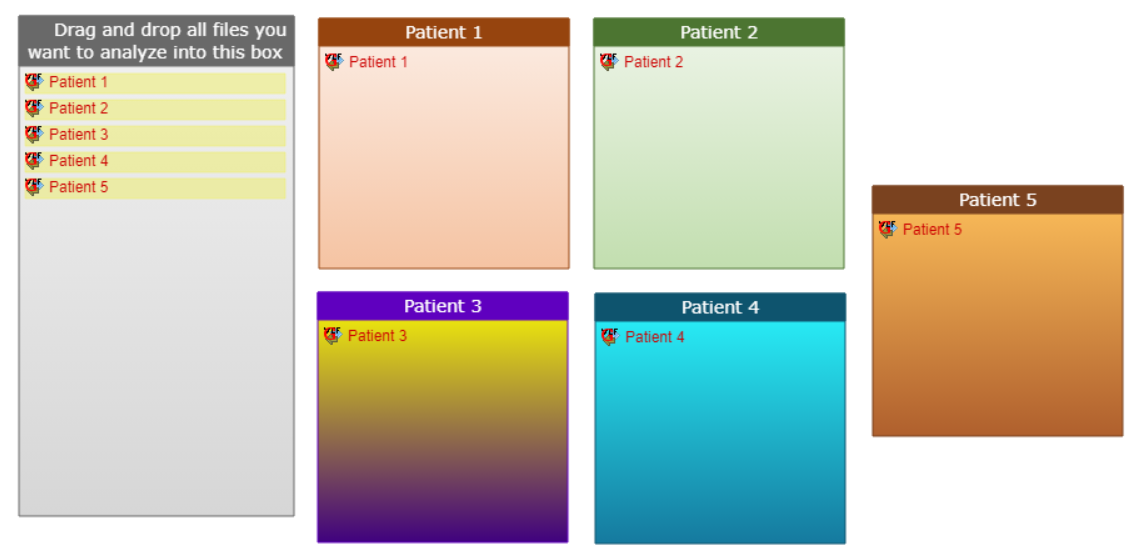
For example, one pathology can be studied, but the goal could be to identify some clusters, which would group different patients, suffering from this pathology, into subgroups. For such design available patient data should be spread among several individual categories (1 category for each patient) and clustering option should be selected at the analysis launch step.
Data from time and drug series can be also analyzed using the multiple conditions comparison.
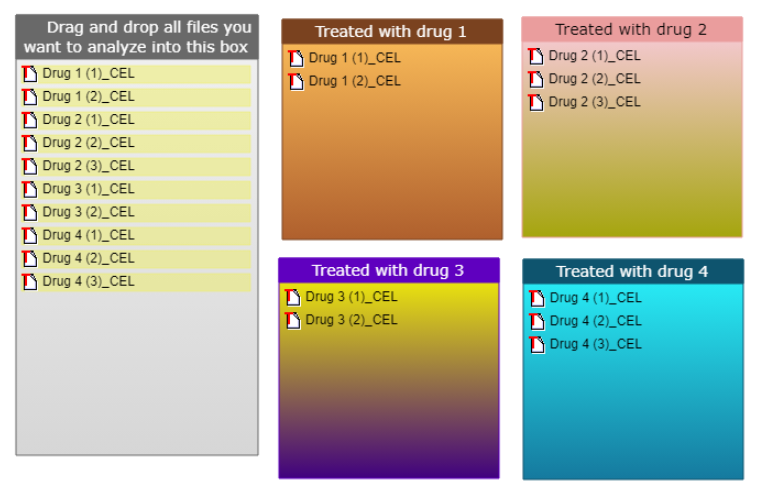
For example, the goal of the study could be to find an optimal set of drug targets and prospective treatments for pathology cell lines, which were pre-treated in drug series. This would allow to select an optimal drug combination for treating the studied pathology. Annotation diagram for such case could look the following way (during the analysis launch the clustering option should be selected).
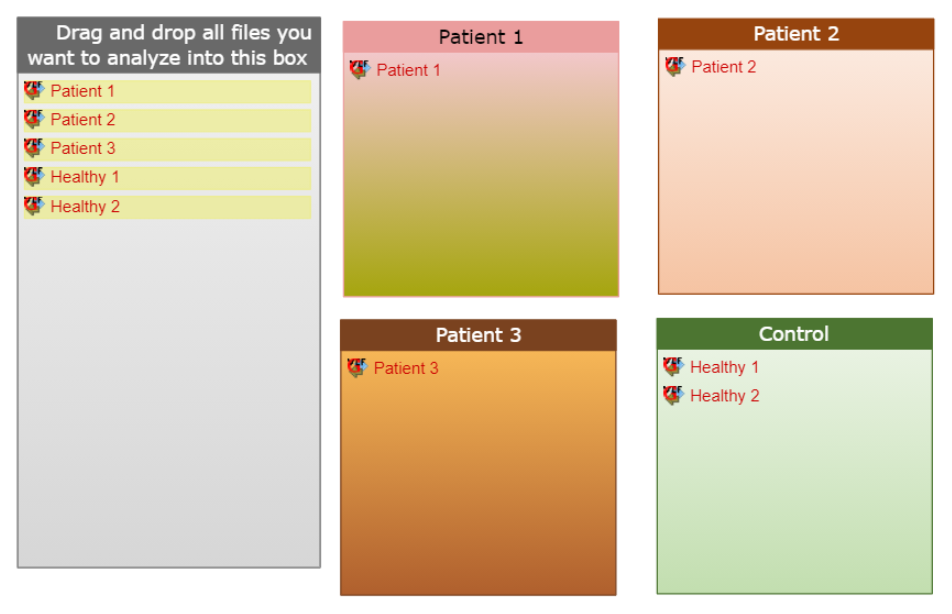
In case the comparisons to the control condition should be done independently, but the eventual goal is to still find the mutual drug targets and prospective treatments for the studied pathology conditions, the respective conditions should be spread among independent categories and control should be selected as baseline during the analysis launch. An example for such scenario could be data, coming from patients with different severity of the studied pathology. You may not want to place all these patients inside one category, since their conditions sufficiently differ, but the final goal is to come up with a unified treatment schema for all of the studied cases. Then data of these patients should be spread among respective categories, but Control condition (data coming from healthy individuals e.g.) should be selected as the baseline option during the analysis launch. In such case the patients will be treated as different cases and independent pairwise comparisons of their data will be made with the control condition, but eventually the mutual prospective drug targets combination will be selected for these patients and respective treatments will be proposed.
Start analysis
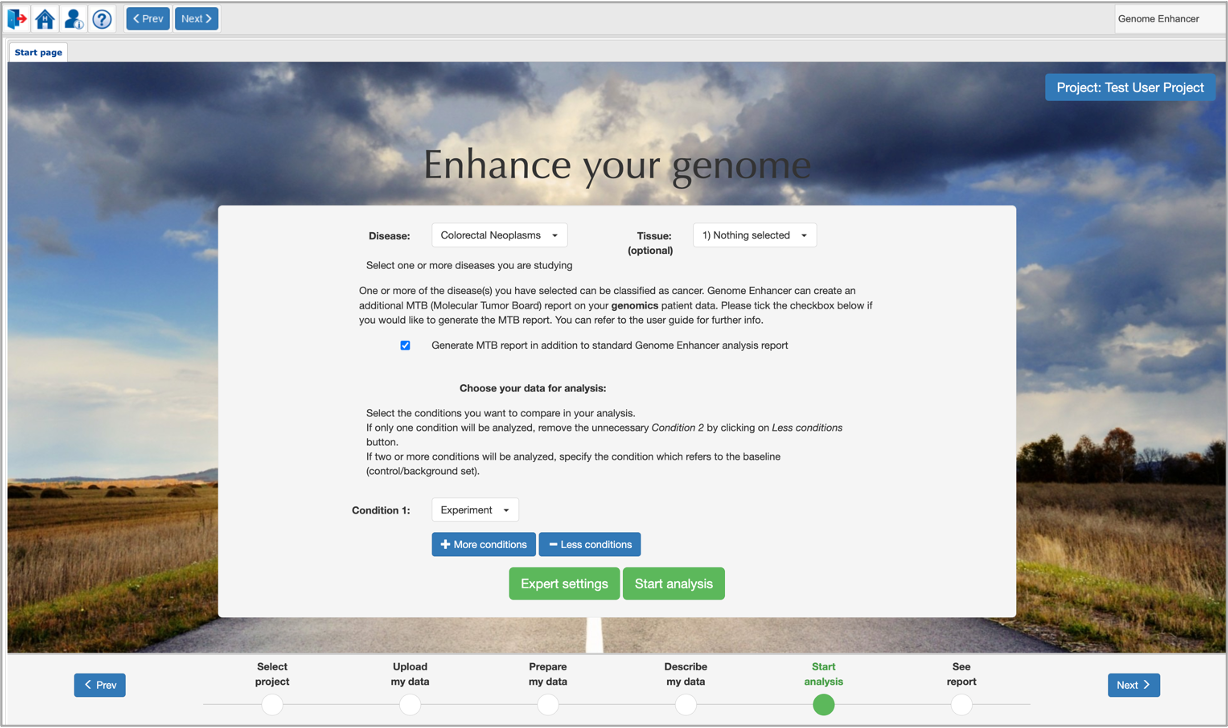
At this step of the Genome Enhancer wizard you need to specify which conditions (boxes from the data annotation diagram) you want to compare for your analysis.
You can add more conditions or remove already existing ones by pressing on the More conditions and Less conditions buttons. By default, you will see two conditions on your screen, the second one will be marked as baseline.
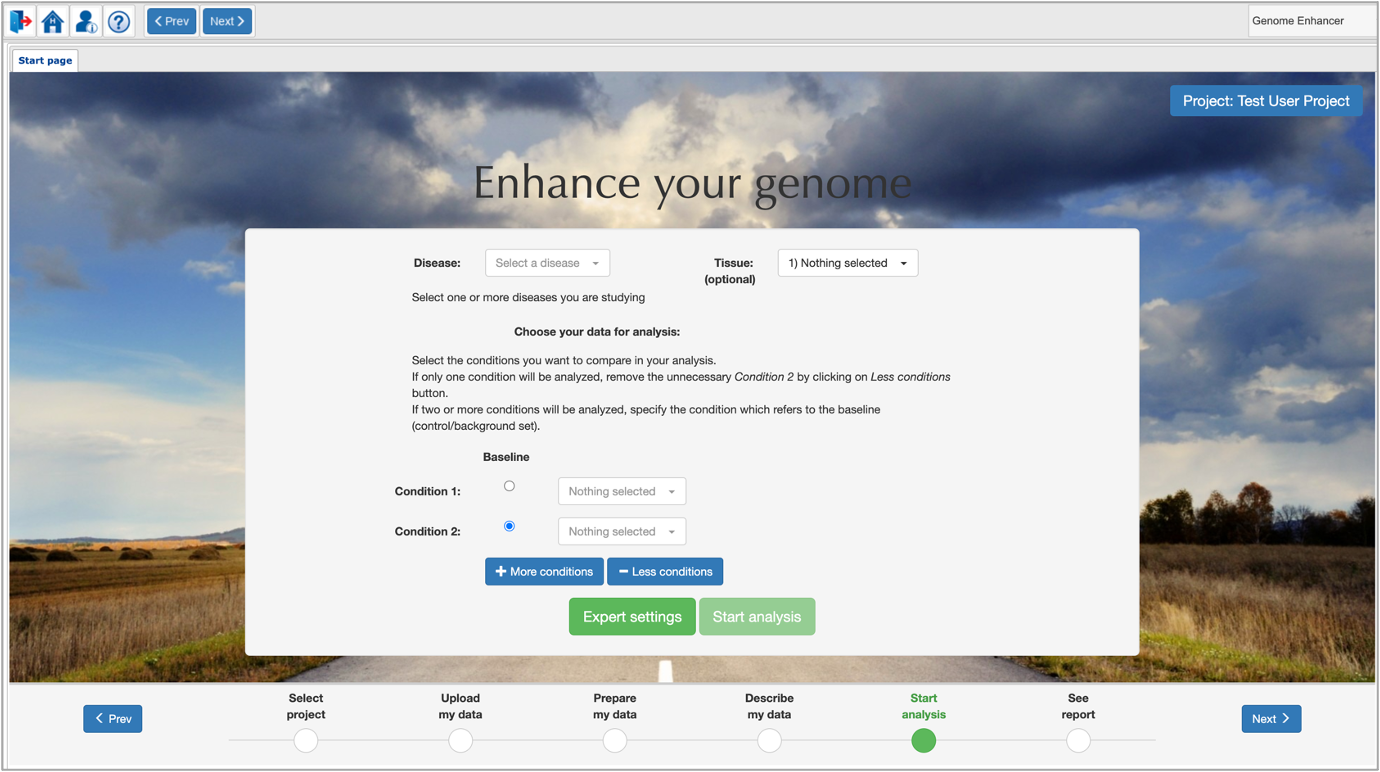
You should specify the conditions you want to compare in your analysis in accordance with the following rules:
- If you have only one condition in your experiment and no baseline available, click on the Less conditions button and specify the condition which you want to analyze in the Condition 1 field. If only one condition is specified, two subsets of the genes will be taken for further analysis (two clusters): maximum 300 genes from the upper part of the gene list sorted by the expression value and maximum 300 genes from the bottom part of the list. If no expression values are provided (ID column only), the whole set of genes specified in the given condition will be taken as one subset (one cluster) for further analysis.
- If you have two conditions to compare, specify them in the Condition 1 and Condition 2 fields and mark with the radiobutton the condition, which corresponds to the baseline. In case of selecting two conditions, the algorithm of Genome Enhancer will perform comparison between Condition 1 and Condition 2 using Limma analysis (e.g. it will identify up-regulated genes as genes whose expression is higher in Condition 1 then in Condition 2).
- If you have three or more conditions to compare, add the necessary number of conditions with the More conditions
button. The new option called Clustering will appear:
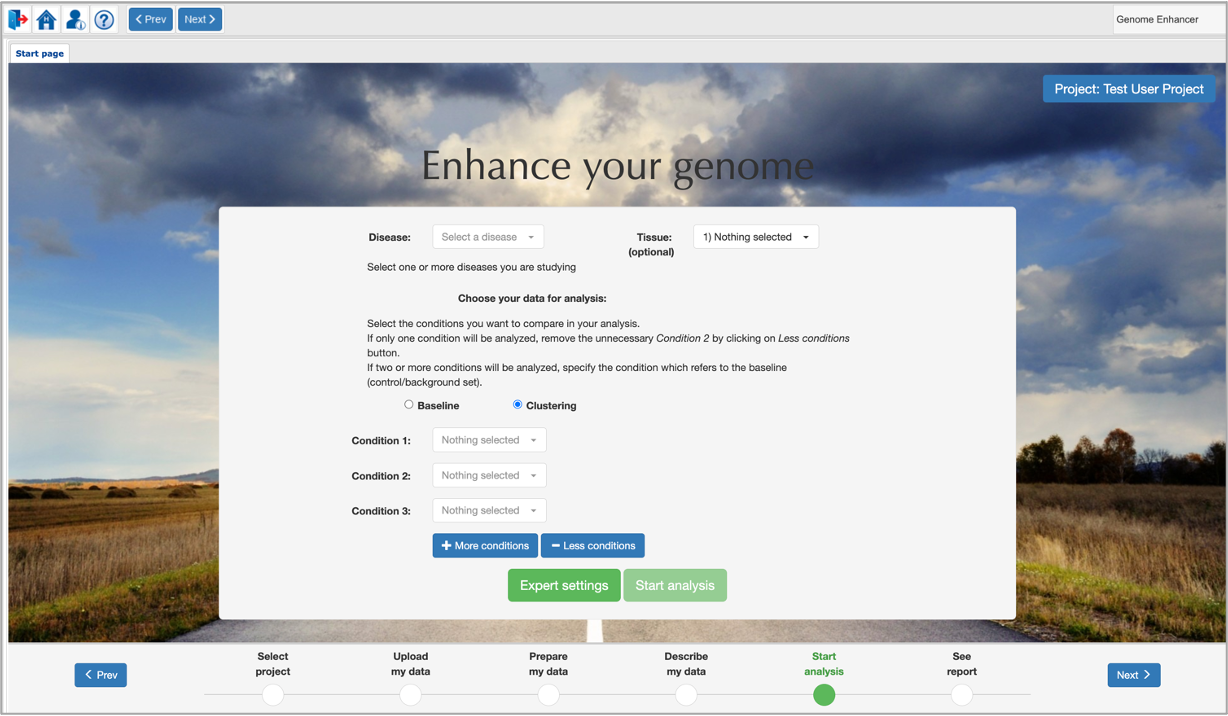 You now will have to specify the conditions you want to compare in the Condition 1,
Condition 2, Condition 3, etc. fields and select with
the radiobutton one of the options: Baseline or Clustering. If Baseline is selected, specify with the radiobutton which of the
conditions refers to the baseline. In this case the analysis will alternatively perform the comparison between each of the
conditions and the baseline (Condition 1 vs. Baseline; Condition 2
vs. Baseline, etc.). If Clustering is selected, the analysis will perform unsupervised clustering of the data through all specified
conditions using CRC (Chinese Restaurant Clustering) algorithm and will select max 3 biggest clusters of genes for further analysis.
You now will have to specify the conditions you want to compare in the Condition 1,
Condition 2, Condition 3, etc. fields and select with
the radiobutton one of the options: Baseline or Clustering. If Baseline is selected, specify with the radiobutton which of the
conditions refers to the baseline. In this case the analysis will alternatively perform the comparison between each of the
conditions and the baseline (Condition 1 vs. Baseline; Condition 2
vs. Baseline, etc.). If Clustering is selected, the analysis will perform unsupervised clustering of the data through all specified
conditions using CRC (Chinese Restaurant Clustering) algorithm and will select max 3 biggest clusters of genes for further analysis.
Adding or removing of conditions at this step of the Genome Enhancer wizard does not affect the data annotation diagram and only influences the data analysis scenario which will be launched once all conditions are specified and the Start analysis button is pressed.
For the analysis launch you can specify the disease or several diseases that you are studying. Genome Enhancer is using the MeSH disease classification.
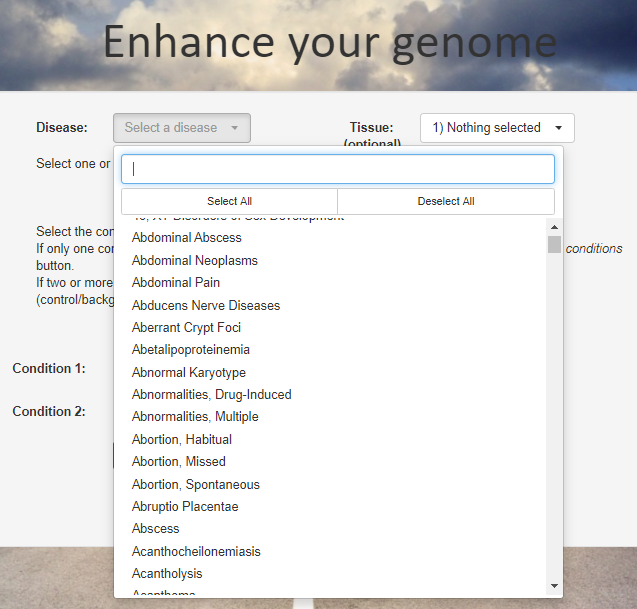
Selecting a disease or several diseases allows Genome Enhancer to inform you about the known connections between the predicted drugs and therapeutic compounds and the diseases of your interest. First of all, it will report which of the predicted drugs are already accepted in the clinical practice or are being tested in clinical trials for the selected diseases. It will also report drugs that are not yet tested for the given disease(s). The clinical trials information will also be given in the full analysis report.
If you will not select any disease for the analysis launch, by default Genome Enhancer will select the "Disease progression" pathology for running the analysis. This pathology characterizes the worsening of any disease over time. Most often it is used for chronic and incurable diseases where the stage of the disease is an important determinant of therapy and prognosis.
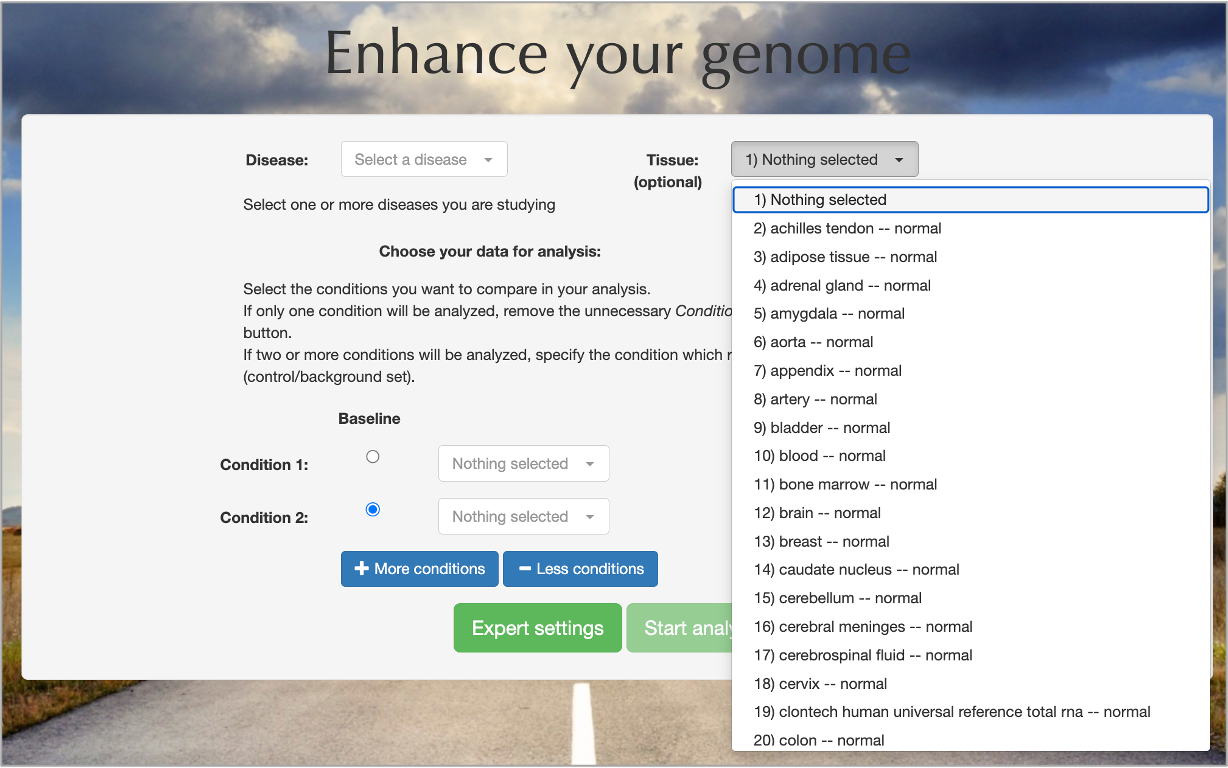
Selecting the type of the tissue from which your samples were initially taken is an optional field, but it allows Genome Enhancer to extract tissue specific promoters with the use of Fantom 5 database. This makes the search for transcription factors binding sites in genome regulatory regions more precise.
Tissue selection is not recommended for studies of oncological diseases: cancerous tumors commonly undergo significant changes in tissue regulation and thus tissue-specific promoter region selection becomes insufficient.
If genomics data were selected for the analysis, one or more diseases associated with cancer from
the supported list of diseases
were selected and the number of specified conditions is not more than 2, then Genome Enhancer will offer you to generate an MTB (Molecular Tumor Board) report.
MTB analysis automatically matches patient-specific genomic alterations to treatment options. The method relies entirely on public knowledge of somatic variants with predictive evidence on drug response. The output report is aimed at supporting clinicians in the task of finding the clinical meaning of genomic variants.
If you tick this option, in the results section together with the standard Genome Enhancer analysis reports Brief Tale and Full Story, additional MTB Report will be displayed.
The MTB analysis reports known somatic variations (mutations, amplifications, deletions, rearrangements) found in the studied patient data and provides their links to expected drug response. The ranking is performed on the basis of clinical evidence coming from public curated databases of predictive biomarkers (GKDB, CIViC).
MTB analysis automatically matches patient-specific genomic alterations to treatment options. The method relies entirely on public knowledge of somatic variants with predictive evidence on drug response. This report is intended for research use only and should not be used for medical or professional advice. GeneXplain GmbH makes no guarantee of the comprehensiveness, reliability, or accuracy of the information on this report.
This tool and the corresponding report structure were developed by Julia Perera-Bel in the research group of Prof. Dr. Tim Beißbarth at the University Medical Center Göttingen (UMG). Perera-Bel J, Hutter B, Heining C, et al. From somatic variants towards precision oncology: Evidence-driven reporting of treatment options in molecular tumor boards. Genome Med. 2018;10(1):18. Published 2018 Mar 15. doi:10.1186/s13073-018-0529-2).
If you will not tick the Generate MTB Report option, MTB report will not be generated in the scope of Genome Enhancer analysis.
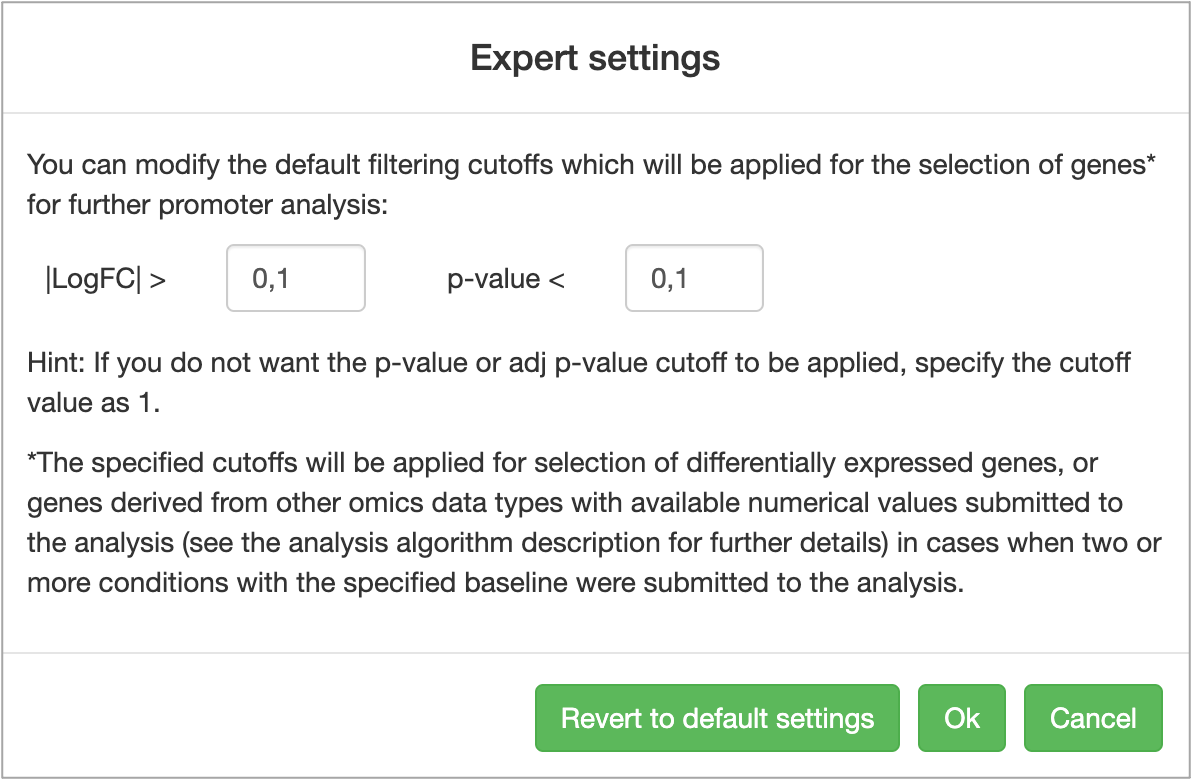
Genome Enhancer allows selection of user-defined cutoffs for identification of differentially expressed genes. You can launch the analysis using the default parameters of |LogFC| > 0.1 and p-value < 0.1, or you can manually specify the cutoffs you want to apply by clicking on the Expert settings button:
After specifying all analysis conditions, launch the Genome Enhancer analysis by clicking on the Start analysis button. This will take you to the last step of the wizard called See report.
Please note that the analysis process along with the report generation procedure take several hours to complete, so you will have to wait for the results to be obtained. You can close the browser once the analysis was launched, there is no need to keep the Genome Enhancer tab open when the analysis is running. When your analysis will be finished, Genome Enhancer will send you an email notification.
See report
This is the last step of the Genome Enhancer wizard.
First of all, please wait for your analysis to be completed. Commonly one analysis run takes 4-8 hours depending on the diversity of the input data. You will receive an email notification from us when your analysis will be finished.
You can close the browser after launching the analysis – there is no need to keep the Genome Enhancer tab open during the analysis process.
You can follow the analysis progress by looking at the percentage of the completed tasks:

 If for any reason you want to pause the analysis process, click on the pause button.
 For completely terminating the analysis, click on the stop button.
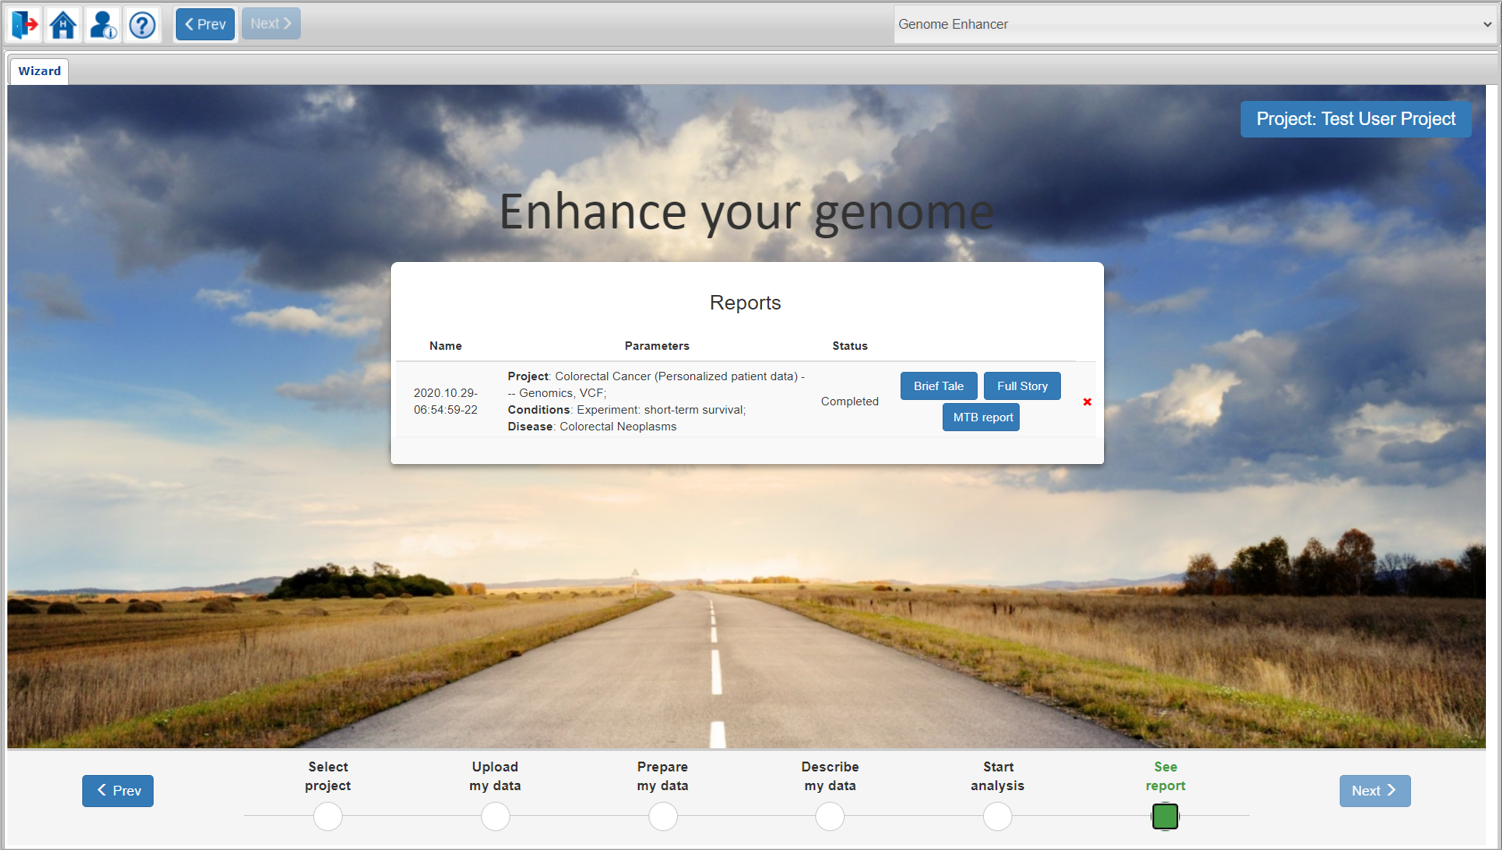
 For completely deleting the analysis with all its results click on the red X on the right.
Once your analysis is successfully finished, you will see links to Brief Tale and Full story reports.
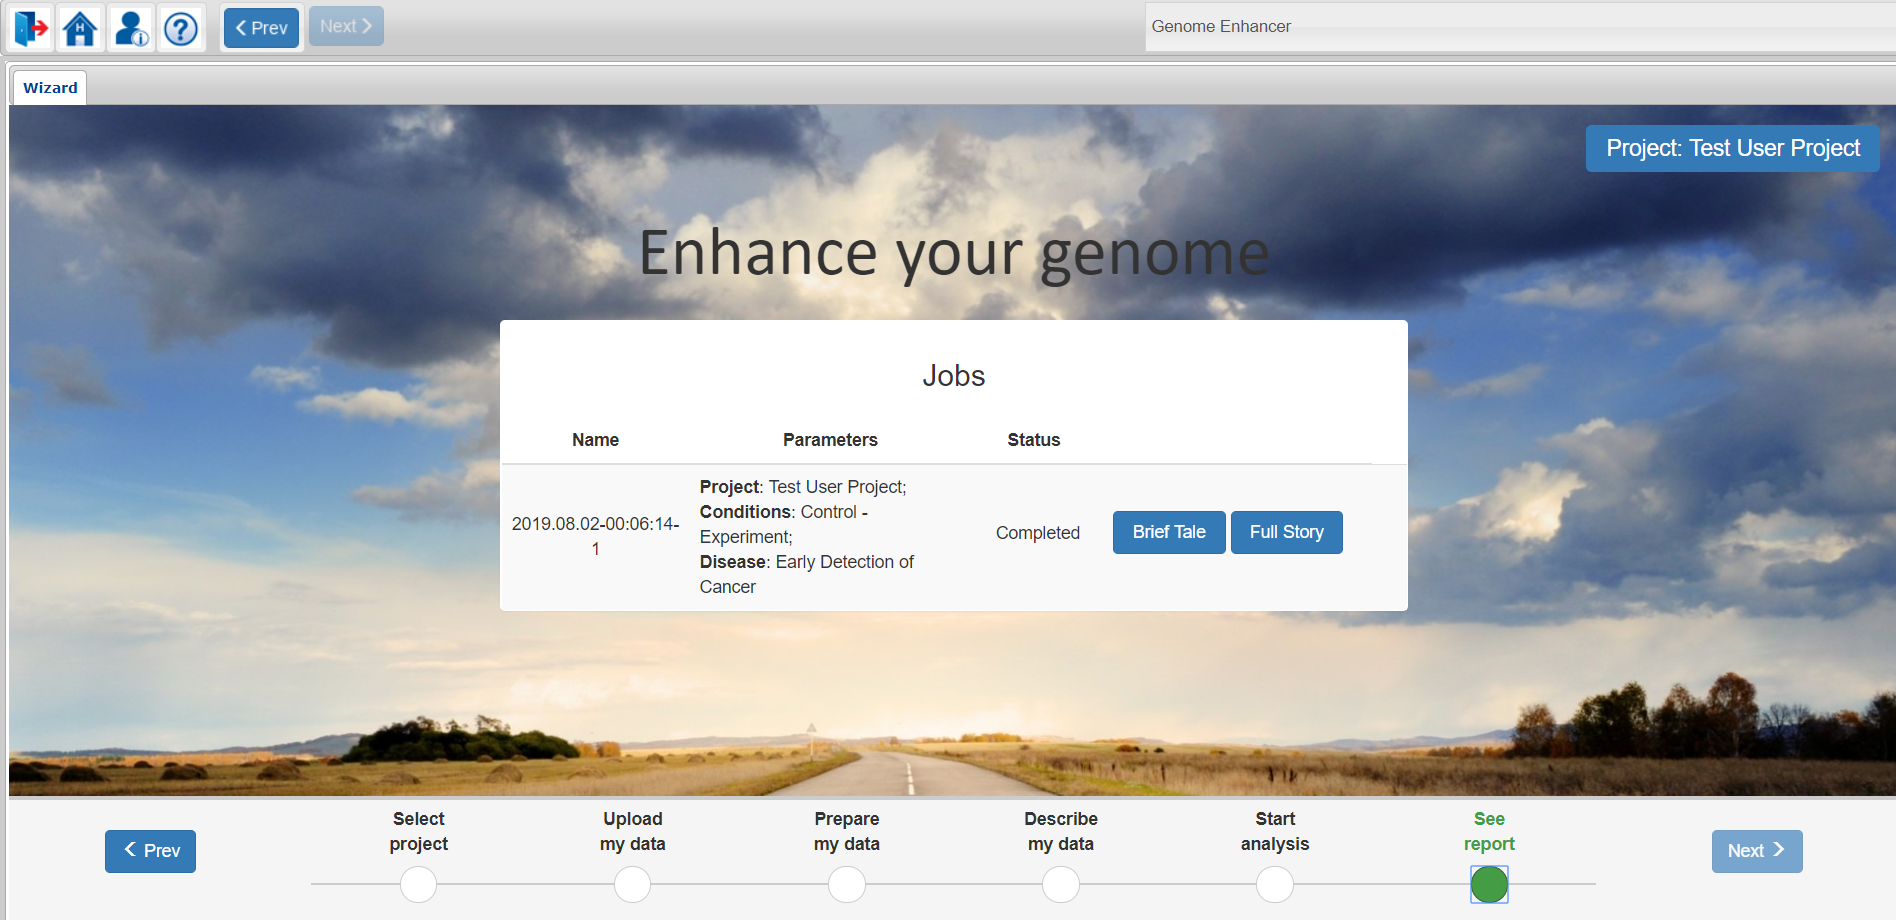
The Brief tale report will provide you with a very brief analysis summary, showing mainly the identified drug targets and the therapeutic compounds predicted to be active against those targets.
The Full story report will guide you through the full analysis process and will give you comprehensive information about the methods used and the results obtained, including genes that characterize the studied pathology, the transcription factors that regulate those genes, and the reconstructed model of the intracellular signaling network with identified master regulators – the potential drug targets for treating the studied pathology. The report will also include information about drug compounds which were predicted to be active against the identified targets.
If you were analyzing genomics data for a cancer-related pathology from the list of supported diseases, and you have ticked the Generate MTB Report option during the analysis launch, the MTB report link will appear next to the Brief Tale and Full Story links in the results window:
You can perform other analysis runs under different conditions in the same project by simply going back to the Start analysis step and launching the new analysis.
Please note that in case no reliable results will be obtained on a certain step of the analysis process, the analysis will be stopped and the report will inform you about the corresponding reason.
Disclaimer
Decisions regarding care and treatment of patients should be fully made by attending doctors. The predicted chemical compounds listed in the report are given only for doctor’s consideration and they cannot be treated as prescribed medication. It is the physician’s responsibility to independently decide whether any, none or all of the predicted compounds can be used solely or in combination for patient treatment purposes, taking into account all applicable information regarding FDA prescribing recommendations for any therapeutic and the patient’s condition, including, but not limited to, the patient’s and family’s medical history, physical examinations, information from various diagnostic tests, and patient preferences in accordance with the current standard of care. Whether or not a particular patient will benefit from a selected therapy is based on many factors and can vary significantly.
The compounds predicted to be active against the identified drug targets in the report are not guaranteed to be active against any particular patient’s condition. GeneXplain GmbH does not give any assurances or guarantees regarding the treatment information and conclusions given in the report. There is no guarantee that any third party will provide a refund for any of the treatment decisions made based on these results. None of the listed compounds was checked by Genome Enhancer for adverse side-effects or even toxic effects.
The analysis report contains information about chemical drug compounds, clinical trials and disease biomarkers retrieved from the HumanPSD™ database of gene-disease assignments maintained and exclusively distributed worldwide by geneXplain GmbH. The information contained in this database is collected from scientific literature and public clinical trials resources. It is updated to the best of geneXplain’s knowledge however we do not guarantee completeness and reliability of this information leaving the final checkup and consideration of the predicted therapies to the medical doctor.
The scientific analysis underlying the Genome Enhancer report employs a complex analysis pipeline which uses geneXplain’s proprietary Upstream Analysis approach, integrated with TRANSFAC® and TRANSPATH® databases maintained and exclusively distributed worldwide by geneXplain GmbH. The pipeline and the databases are updated to the best of geneXplain’s knowledge and belief, however, geneXplain GmbH shall not give a warranty as to the characteristics or to the content and any of the results produced by Genome Enhancer. Moreover, any warranty concerning the completeness, up-to-dateness, correctness and usability of Genome Enhancer information and results produced by it, shall be excluded.
The results produced by Genome Enhancer, including the analysis report, severely depend on the quality of input data used for the analysis. It is the responsibility of Genome Enhancer users to check the input data quality and parameters used for running the Genome Enhancer pipeline.
Note that the text given in the report is not unique and can be fully or partially repeated in other Genome Enhancer analysis reports, including reports of other users. This should be considered when publishing any results or excerpts from the report. This restriction refers only to the general description of analysis methods used for generating the report. All data and graphics referring to the concrete set of input data, including lists of mutated genes, differentially expressed genes/proteins/metabolites, functional classifications, identified transcription factors and master-regulators, constructed molecular networks, lists of chemical compounds and reconstructed model of molecular mechanisms of the studied pathology are unique in respect to the used input data set and Genome Enhancer pipeline parameters used for the current run.
For further assistance please contact support@genexplain.com